
We're officially into the latter half of 2021, and eCommerce is showing little sign of slowing down. Despite the majority of restrictions (as of this writing) lifted, it seems as though folks aren't ready to give up the convenience of shopping online.
In order to give you a deeper look into what's been going on over the last quarter, we're back to provide you with yet another detailed look into eCommerce performance across Q2 2021.
With our unique position in the eCommerce ecosystem, Klickly is able to generate a huge amount of proprietary data. Because of this, we have a much more nuanced view into digital performance than most other platforms.
By curating this data we can help merchants, marketers, and beyond make well-informed, data-backed decisions setting them up for success as we continue to navigate 2021.
Our Q2 2021 data report consists of over 600 million data points from over 1200 eCommerce merchants across 11 verticals. We anonymously aggregated these data points and examined the week-to-week shift in D2C performance, order details, and on-site behavior.

An overview of eCommerce as a whole
Performance:
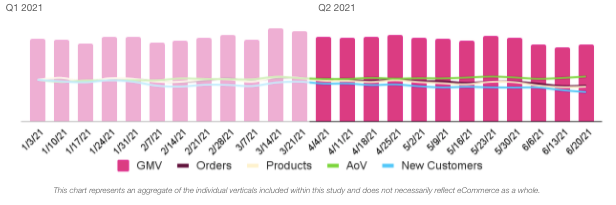
Per usual, we first took a look at overall performance. We analyzed GMV, number of orders, number of products, number of new customers, and the average order value on a week-to-week basis across the previous and current quarters.
For a detailed look into Q1 you can check out our previous quarter data report findings. Q2 maintained much of what we saw in Q1, however we did see a slight dip in revenues from Q1's highs.
This was primarily driven by the number of orders, products sold, and rate of new customers. On the other hand, the average order value remained steady — even seeing a slight uptick towards the latter half of the quarter.
Overall, customers were purchasing less frequently, but they were purchasing a slightly higher cart value. Notably, we saw a greater number of returning customers in Q2.
Order behaviors:
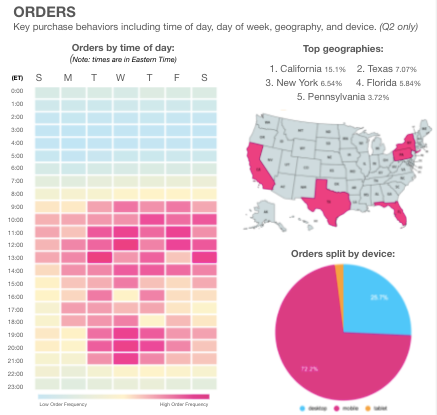
Secondly, we wanted to get a sense of when, where, and how consumers were shopping.
The biggest difference we noticed was the distribution of orders throughout the entire week. In Q1, we started seeing a slight shift of orders skewing away from the weekend. Q2 continued that trend, with the top days for purchase being Wednesday, Thursday, and Tuesday. This is the first time we saw no "weekend" days within the top three.
One theory is that this could be due to the continued remote work for many consumers leading to a change in shopping habits.
There are typically a few categories with outlier states claiming the top 5 geo locations; however, in Q1 the top 5 states were fairly consistent throughout. Large populous states were responsible for the highest order volumes. However, it is interesting to see overall the percentage of sales coming from California was more than double that of the next closest state, Texas.
Mobile continued to be the desired device for purchases — especially for verticals that are impulse, consumable, or repeatable. This was also the first quarter we began to see alternate channels for sales — there were a handful of purchases made through “Smart TV”.
On-Site behaviors:
Finally we explored the basic on-site consumer behaviors: traffic, click rates, and conversion rates.
Both on-site traffic and click rates held steady throughout Q2. For the first time this was seen across nearly all verticals — seeing only nominal changes.
However the conversion rates saw a decline. Although the conversion rate decreased by 8%, the previous quarter saw an 8% increase, so the rate of conversion leveled out.
Brands may want to take this opportunity to ensure their store is optimized for conversions. Reviewing the previous quarter for any changes that might have contributed to the conversion increase and subsequent decrease could be beneficial.
This could show that the previous quarter's tax returns and one stimulus payment played a role in the increase from our last report.
Key takeaways:
There’s a lot that can be taken away from this study and hopefully marketers can pinpoint certain areas that are relevant to their digital strategy. There are three main takeaways overall that we saw when doing this study.
- Traffic was still there. We didn't see a slowdown post holidays and we still saw the same level this quarter.
- Customers were still engaged. That traffic is actively engaging with brand's sites and products.
- Conversion and acquisition were the largest opportunities. The steady level of engagement and decrease in new customer orders could indicate that brands should review and optimize their customer acquisition strategies and paths to conversion.
Conclusion:
While we are now in the home stretch for 2021. Thus far, this year has proved to hold the momentum we've seen over the last few reports. In Q3 brands will be preparing for Black Friday / Cyber Monday, and if these trends continue, it seems like they can expect to see another wildly successful Q3 and Q4.
We urge brands to continue looking at their data and optimizing to set themselves up for success.
While the above outlines eCommerce as a whole, we invite you to download the full report to view vertical-specific information to help inform your decisions throughout Q1.
We cannot stress enough the importance of making informed decisions when it comes to your business — we’re excited to provide helpful research initiatives that give a deeper look into eCommerce performance, trends, and insights.
Klickly will continue to provide quarterly data reports to help you as marketers, merchants, and beyond, better prepare for the future. We hope you’ll keep checking back to take advantage of this free data.
About Klickly
Klickly is the world’s only full-funnel, real-time consumer data software platform that enables distributed commerce. Klickly’s evergreen data engine leverages billions of full-funnel events and millions of data profiles to predict both who will buy and when they’re ready to purchase. At the nexus of data, commerce, and payments, the company's proprietary technology powers multi-channel offer prioritization, intelligent product discovery, in-ad buying, and customer acquisition for thousands of fast-growing DTC brands.
