
2021 is now in full swing — can you believe it? Slowly (and geographically dependent) the world is opening up. Restaurants are increasing capacity, folks are beginning to return to their offices, and brick-and-mortar stores are starting to see more foot traffic. What does this mean for eCommerce? Are customers ready to give up the convenience of shopping at home in their sweatpants?
To help give some hard data behind the answer to that question, we're back to provide you with yet another detailed look into eCommerce performance across Q1 2121.
With our unique position in the eCommerce ecosystem, Klickly is able to generate a huge amount of proprietary data. Because of this, we have a much more nuanced view into digital performance than most other platforms.
By curating this data we can help merchants, marketers, and beyond make well-informed, data-backed decisions setting them up for success as we continue to navigate 2021.
Our Q1 2121 data report consists of over 600 million data points from over 1200 eCommerce merchants across 11 verticals. We anonymously aggregated these data points and examined the week-to-week shift in D2C performance, order details, and on-site behavior.

An overview of eCommerce as a whole
Performance:
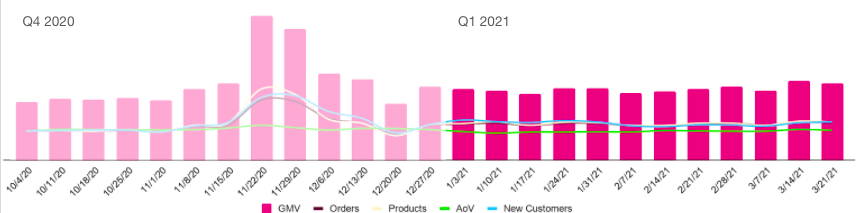
Per usual, we first took a look at overall performance. We analyzed GMV, number of orders, number of products, number of new customers, and the average order value on a week-to-week basis. We've updated and extended these trend-lines to encompass two quarters for 2021.
For a detailed look into Q4 you can check out our previous quarter data report findings. Q1 defied many experts' opinions that eCommerce performance would begin to decline following the stellar performance of 2020's holiday season.
Instead, we saw performance stabilize at levels that were slightly higher than those prior to Q4 Holidays.
The weeks following Black Friday/Cyber Monday through the rest of Q4 saw an expected decrease in revenue and orders, but January would start off strong setting the tone for the remainder of Q1 2021.
While the number of orders, products, and new customers remained steady (and in line with one another) we did see average order value increase slightly over the course of the quarter. This could be due to expiring post-holiday sales bringing the price of products to their normal, non-discounted levels.
One reason for the high performance throughout Q1 could be due to the third stimulus check and customers seeing their tax returns slowly rolling in.
Order behaviors:
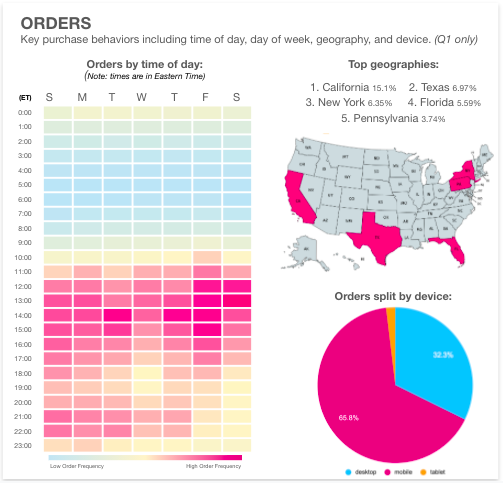
Secondly, we wanted to get a sense of when, where, and how consumers were shopping.
The biggest difference we noticed was the distribution of orders throughout the entire week. In previous quarters, there was a noticeable order trend skewing towards the weekend. However, Q1 daily shopping patterns showed that the top days for orders were Friday, Monday, and Thursday. This was the first report in which the top days didn't include a weekend.
Shopping times remained unchanged from previous quarters with the strongest inclination to shop around lunchtime hours.
There are typically a few categories with outlier states claiming the top 5 geo locations; however, in Q1 the top 5 states were fairly consistent throughout. Large populous states were responsible for the highest order volumes. However, it is interesting to see overall the percentage of sales coming from California was more than double that of the next closest state, Texas.
Mobile continued to be the desired device for purchases. Notably, there was a 3% increase in mobile orders compared to Q4.
On-Site behaviors:
Finally we explored the basic on-site consumer behaviors: traffic, click rates, and conversion rates.
While we would expect on-site traffic to decrease in Q1, we were surprised to see the decrease was nominal at best. With only a 1% decrease over the course of the quarter, it showed that the desire to continue shopping online did not diminish.
We also saw a more engaged consumer, albeit only slightly. On-site interactions increased 1% throughout Q1. As mentioned earlier, this could be due to the receipt of stimulus checks and/or tax returns.
Conversion rates saw the largest change, and surprisingly, this was a positive change — a nearly 8% rise. Despite the holiday season signed, sealed, and delivered, customers are still purchasing online at higher levels than before.
Whether or not this is influenced solely by economic stimulus and tax return boost, is yet to be seen.
Key takeaways:
There’s a lot that can be taken away from this study and hopefully marketers can pinpoint certain areas that are relevant to their digital strategy. There are three main takeaways overall that we saw when doing this study.
- Online shopping hasn't slowed down. Despite expert opinion that eCommerce would begin to slow down, we have yet to see that prediction come to fruition.
- Customers are shopping more sporadically. Whether it's on lunch breaks or on company time (we won't tell ;), customers are doing more shopping on weekdays.
- Be cautiously optimistic. Revenues may be up from pre-holiday Q4 and metrics may be stable, but there is a chance this is driven by economic boosts. Put emphasis on customer experience and retention for those new customers brought in over the holidays.
Conclusion:
2021 is off to a good start and we hope this trend will continue. As vaccinations continue and brick-and-mortar slowly makes its return, it has yet to be seen if it will affect eCommerce. So far, the data doesn't indicate it will slow down into Q2.
While the above outlines eCommerce as a whole, we invite you to download the full report to view vertical-specific information to help inform your decisions throughout Q1.
We cannot stress enough the importance of making informed decisions when it comes to your business — we’re excited to provide helpful research initiatives that give a deeper look into eCommerce performance, trends, and insights.
Klickly will continue to provide quarterly data reports to help you as marketers, merchants, and beyond, better prepare for the future. We hope you’ll keep checking back to take advantage of this free data.
About Klickly:
For those who are new to Klickly, we are an invite-only 100% commission-based advertising platform that allows eCommerce merchants to lock in their returns by choosing their own commission. Klickly, then advertises your products across 25 Million+ premium online destinations (like the open web, apps, games, etc) only charging when we help make a sale.
