

As we make our way into Q4 2020, there's still a sense of the "unknown" as it relates to what we can expect of eCommerce performance. As it stands with less than a month until BFCM, eCommerce will likely be the clear winner this year as many brick-and-mortar retailers remain under strict guidelines or even temporarily closed.
As such you should be prepared NOW when it comes to your eCommerce strategy this holiday season. As marketers and business owners, data should be a key driver in making informed business and digital strategy decisions. But, the amount of data out there can often be overwhelming and hard to access.
With our unique position in the eCommerce ecosystem, Klickly is able to generate a huge amount of proprietary data. Because of this, we have a much more nuanced view into digital performance than most other platforms.
By curating this data we can help merchants, marketers, and beyond make well-informed, data-backed decisions setting them up for success as we continue to navigate 2020.
Our Q3 2020 data report consists of over 600 million data points from over 1200 eCommerce merchants across 11 verticals. We anonymously aggregated these data points and examined the week-to-week shift in D2C performance, order details, and on-site behavior.
An overview of eCommerce as a whole
Performance:
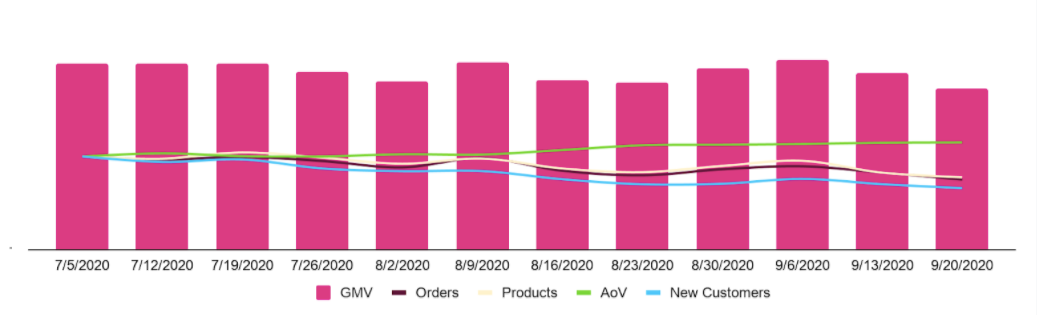
The first area we decided to look at was overall performance. We analyzed GMV, number of orders, number of products, number of new customers, and the average order value on a week-to-week basis.
Throughout Q2 we saw large spikes — especially in April — that slowly began to decline throughout the latter half of the quarter. These large spikes were likely driven by the sudden eCommerce shift and the receipt of stimulus checks, however as this "new normal" appeared a bit more long-term and the one-time stimulus checks ran out, we began to see a dip in eCommerce performance.
Compared with the previous quarter, Q3's story was about stabilization. As we made our way through Q3, the most notable trends were more purchases driven by repeat customers and higher cart values. We saw nearly a 25% decrease in the rate of orders driven by brand-new customers, however a roughly 13% increase in the average order value.
While we did see a decrease across order frequency and brand-new customers, this higher cart value could indicate a slight return of confidence when it comes to larger purchases. Or folks are purchasing on impulse less frequently and saving to purchase later.
Order behaviors:
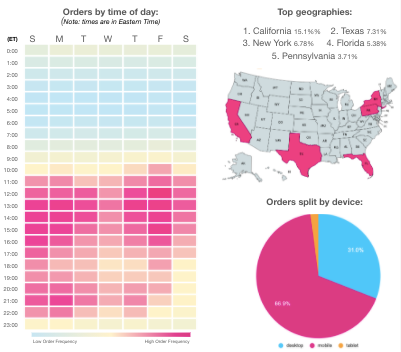
We also wanted to get a sense of when, where, and how consumers were shopping. We saw a slight shift in Q3 in regards to when folks were purchasing. Friday still remained one of the top days for customers to shop; however, it appeared there was a tendency for people to purchase earlier in the week (Sunday and Monday) this quarter compared to the latter half of the week as found previously.
As we saw before, folks are either taking advantage of lunch-time shopping — or if you’re on pacific time, have a tendency to grab their phone first thing in the morning and start shopping.
Aside from a few outlier verticals (Babies & Children, Sports & Fitness, and Pets), states with large populations were responsible for the highest order volumes. However, it is interesting to see overall the percentage of sales coming from California was nearly double that of the next closest state, Texas.
On-Site behaviors:
Finally we wanted to explore the basic on-site consumer behaviors: traffic, click rates, and conversion rates. Overall, we saw online traffic and click rates hold steady this quarter. This is a dramatically different story than Q2 which saw a large increase in traffic and an even larger decrease in click-rate.
Customers appear to have adjusted to the eCommerce first landscape and are continuing to engage online.
Conversion rates continued to decline, albeit at a much slower rate than the previous quarter. While there are still a large number of window shoppers, we saw more people were engaging with products and were less hesitant to convert. However, merchants should still take a close look at their strategies when when it comes to on-site conversion.
Key takeaways:
There’s a lot that can be taken away from this study and hopefully marketers can pinpoint certain areas that are relevant to their digital strategy. I think there’s four main takeaways overall that we saw when doing this study.
- Make sure to have a good customer acquisition strategy. The online audience is still there, and so is your competition. Look at ways you can leverage new channels for customer acquisition.
- Supercharge your retention efforts. Have a solid loyalty strategy that keeps your customer coming back for more. Continue to send them loving reminders via email, text, retargeting, etc.
- Evaluate the strength of your conversion strategy. Conversion rates continued to decline over the course of Q3, so you should evaluate your strategy and optimize where it falls short.
- Discounts are in. While overall average order value is up, we saw several verticals that likely fueled their revenues via promotions on lower priced items. This can help with customer acquisition and place them into your retention funnel.
Conclusion:
It continues to be an interesting year, especially for eCommerce. While the above outlines eCommerce as a whole, we invite you to download the full report to view vertical-specific information to help inform your decisions moving into Q3.
We cannot stress enough the importance of making informed decisions when it comes to your business and excited to provide helpful research initiatives that give a deeper look into eCommerce performance, trends, and insights.
Klickly will continue to provide quarterly data reports to help you as marketers, merchants, and beyond, better prepare for the future. We hope you’ll sign up to take advantage of this free data.
About Klickly:
For those who are new to Klickly, we are an invite-only 100% commission-based advertising platform that allows eCommerce merchants to lock in their returns by choosing their own commission. Klickly, then advertises your products across 25Million+ premium online destinations (like the open web, apps, games, etc) only charging when we help make a sale.
